

Last updated: 13 October 2026. Poverty estimates differ by method and date, so we name the source and year each time.
Around 141 million Nigerians — roughly 62% of the population — are projected to live below the national poverty line in 2026, according to PwC’s Nigeria Economic Outlook. The World Bank’s April 2026 Nigeria Development Update puts the 2025 rate at approximately 63%, projecting only a gradual decline to around 59% by 2028 under baseline conditions. Both figures use the national monetary poverty line. The bottom line: despite real macroeconomic reforms, poverty in Nigeria in 2026 remains at a generational high, and the pace of reduction is far too slow to meaningfully change households’ realities in the near term.
They are consistent, not contradictory.*
Key Takeaways
| Point | Details |
|---|---|
| 2026 headline estimate | PwC projects ~62% (141 million people); World Bank’s 2025 observed rate is ~63%, declining to ~59% by 2028. |
| Primary drivers | Food inflation, fuel subsidy removal, weak job growth, and conflict in food-producing regions drove the 2019–2025 rise. |
| MPI vs. monetary poverty | Nigeria’s MPI headcount is 33.0% (2021 data); the monetary rate is 62–63%. Both are valid but measure different deprivations. |
| Subnational concentration | Sokoto, Jigawa, and Zamfara carry the highest poverty burden; Lagos and Rivers are among the lowest. |
| Policy priority | Scaling targeted cash transfers and resolving the NIMS integration bottleneck are the fastest levers for near-term poverty reduction. |
Table of Contents
- What do the poverty statistics for Nigeria show from 2019 to 2026?
- Why did poverty rise so sharply between 2019 and 2025?
- Who is most affected: states, rural areas, and vulnerable groups?
- How is poverty measured in Nigeria, and what are the limits of those measures?
- How do the 2026 projections compare, and what scenarios could change the outlook?
- What is Nigeria doing about poverty, and where are the gaps?
- What do these numbers mean for Nigerian households day to day?
- Where do the 2026 figures come from, and how should you read them?
- Why haven’t macro gains reached households? An expert view
- Sources
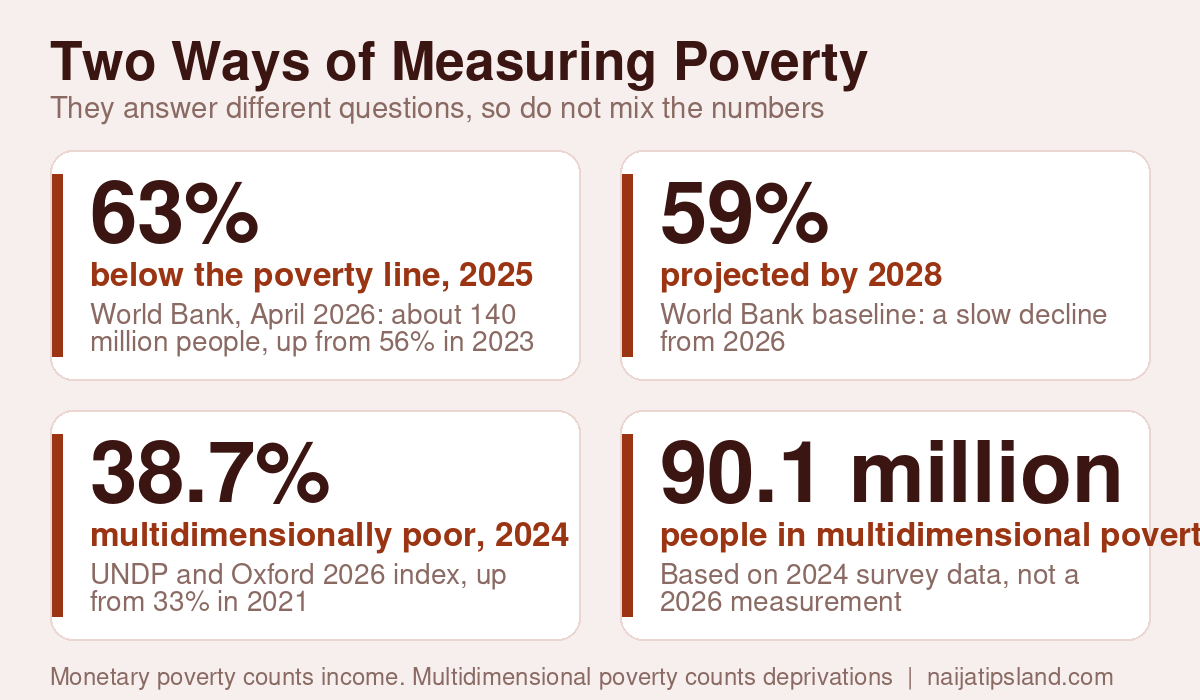
Update, October 2026: Two Measures, Two Stories
- World Bank (monetary poverty): the April 2026 Nigeria Development Update put the poverty rate at 63% in 2025, about 140 million people, up from 56% in 2023 and 61% in 2024, even as inflation eased. It projects a slow decline to about 59% by 2028.
- UNDP and Oxford (multidimensional poverty): the 2026 Global MPI, released on 12 October 2026, says 38.7% of Nigerians, about 90.1 million people, were multidimensionally poor in 2024, up from 33% (72.2 million) in 2021. It is based on 2024 survey data, so it is not a measurement of 2026.
- Growth is not enough on its own: the World Bank’s October 2026 Africa Economic Update says regional growth remains too modest to cut poverty significantly. Nigeria’s economy grew 4.43% in the second quarter of 2026, but food prices and weak job creation still squeeze households.
The two measures answer different questions. Monetary poverty compares income or spending with a poverty line. Multidimensional poverty counts overlapping deprivations in health, education and living standards. Do not add or compare them directly.
What do the poverty statistics for Nigeria show from 2019 to 2026?
The trajectory is stark. Nigeria’s national poverty headcount ratio sat at 40.1% in 2019 — about 82.9 million people — based on the National Bureau of Statistics (NBS) household survey, which excluded Borno State from that calculation. By 2025, the World Bank noted that the poverty rate had risen significantly compared to 2019.
The 2024–2025 spike is the sharpest single-period increase in recent Nigerian history. Fuel subsidy removal in mid-2023 and the simultaneous naira devaluation compressed household purchasing power almost immediately. Bloomberg’s October 2025 reporting on World Bank analysis described the situation plainly: half of Nigeria lives in poverty despite reform. The 2026 PwC figure of 141 million is slightly higher in absolute terms than the 2025 World Bank estimate because population growth continues even as the rate edges marginally lower.
The IMF’s 2026 Article IV consultation confirmed the 63% poverty rate for 2025 and flagged that higher global food and fertilizer prices remain a live downside risk for 2026.
Why did poverty rise so sharply between 2019 and 2025?
No single shock explains the scale of the increase. Several drivers compounded each other, and separating them matters for understanding what policy can actually fix.
- Fuel subsidy removal and FX liberalization (2023): The Tinubu administration’s decision to remove fuel subsidies and unify the exchange rate in mid-2023 was structurally necessary but imposed immediate costs on households. Transport and food prices surged within weeks. PwC analysts note these reforms delivered macro stabilization while pushing additional millions below the poverty line in 2025–2026.
- Persistent food price inflation: Nigeria’s food inflation ran at multi-decade highs through 2023–2024. Poor households spend up to approximately 70% of their income on food, so food-price shocks hit them with disproportionate force. Even as headline inflation began cooling into 2025, prices remained elevated relative to pre-shock levels — disinflation does not restore purchasing power.
- Weak job creation, especially for youth: The economy has not generated enough formal employment to absorb Nigeria’s young and growing labor force. Youth unemployment and graduate unemployment remain structurally high, meaning income gains from growth have concentrated in sectors that employ relatively few people. For more on the skills gap driving this, see Naijatipsland’s analysis of skills in demand for Nigerian professionals in 2026.
- Conflict and displacement in food-producing regions: Insecurity in the Northwest and Northeast disrupted agricultural production and supply chains. Displaced farming communities lost both livelihoods and food access simultaneously.
- Low agricultural productivity: Nigeria’s smallholder farmers face limited access to inputs, credit, and markets. When global fertilizer prices spiked following the Russia-Ukraine war, Nigerian farmers reduced input use, cutting yields and worsening food supply.
- COVID-19 recovery lag: The pandemic erased income gains for millions of informal workers. Recovery was uneven, and many households had not returned to pre-2020 welfare levels before the 2023 reform shocks arrived.
Pro Tip: When analyzing Nigeria’s recent poverty data, distinguish between structural drivers (weak job creation, low agricultural productivity) and shock-driven drivers (subsidy removal, FX devaluation). Structural drivers require multi-year policy responses; shock-driven drivers can sometimes be partially offset by targeted transfers within months. Conflating the two leads to misdiagnosed policy prescriptions.
Who is most affected: states, rural areas, and vulnerable groups?
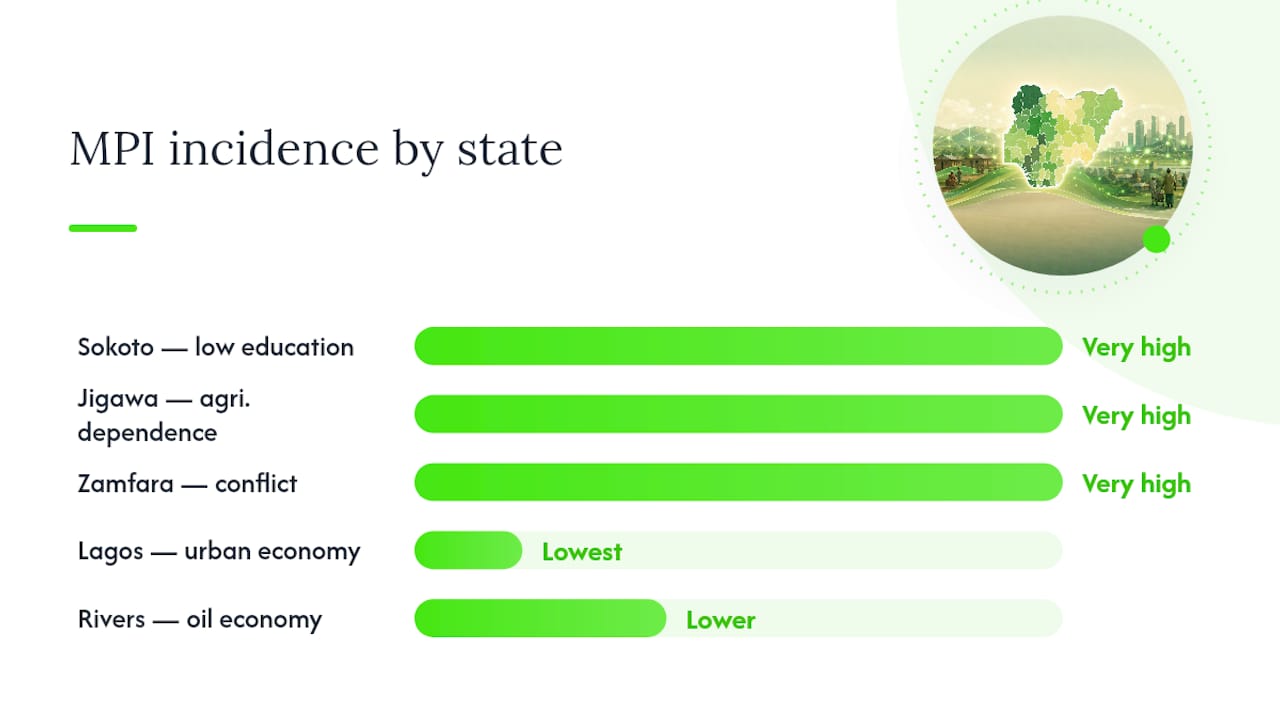
The national average conceals enormous geographic variation. OPHI’s 2025 Global MPI country brief reports a multidimensional poverty headcount of 33.0% nationally (based on 2021 survey data), but subnational figures diverge sharply. States in the Northwest and Northeast carry the heaviest burden.
| State/Region | MPI Poverty Incidence (approx.) | Primary Driver |
|---|---|---|
| Sokoto | Very high (among top 3 nationally) | Low education, limited health access |
| Jigawa | Very high | Agricultural dependence, low income |
| Zamfara | Very high | Conflict, displacement |
| Lagos | Among lowest nationally | Urban economy, formal employment |
| Rivers | Relatively lower | Oil economy, urban services |
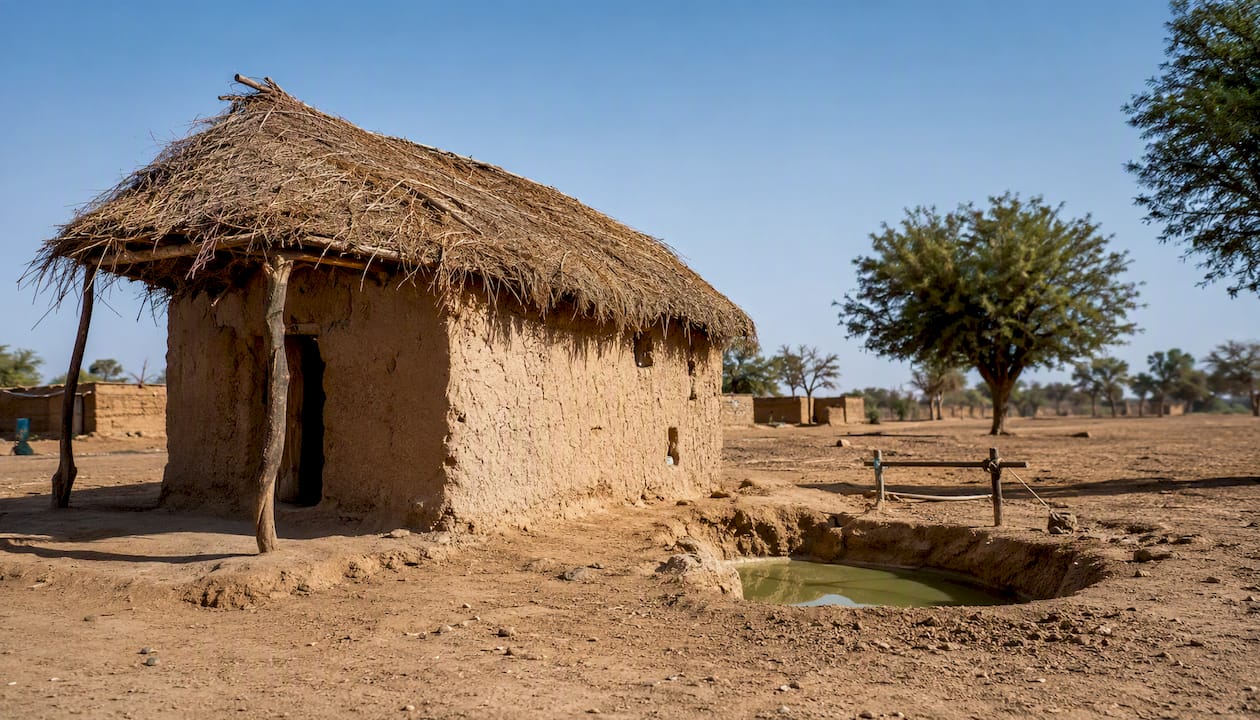
Rural areas show far higher MPI headcounts and intensity than urban centers. The gap is not marginal. Rural households face compounding deprivations: limited access to clean water, electricity, quality schools, and health facilities, alongside income poverty. Urban poverty is real and growing — particularly in informal settlements — but rural poverty is deeper and more entrenched.
Demographic concentration of poverty follows predictable patterns:
- Children under 15 face the highest exposure; child poverty rates exceed adult rates in most northern states.
- Women in rural areas, particularly those without formal education, face greater poverty depth due to limited land rights and restricted access to credit.
- Displaced households from conflict-affected states carry compounded vulnerability: loss of assets, disrupted livelihoods, and reduced access to services.
- Smallholder farming households — the majority of Nigeria’s rural poor — are directly exposed to both food-price volatility and climate-related harvest failures.
How is poverty measured in Nigeria, and what are the limits of those measures?
Two primary frameworks apply to Nigeria, and they produce very different headline numbers. Understanding which one you’re reading matters.
National monetary poverty line: The NBS measures the share of the population whose consumption falls below a nationally defined poverty line. It captures income and consumption but misses non-income deprivations like lack of schooling or clean water.
Multidimensional Poverty Index (MPI): Developed by OPHI and reported by UNDP, the MPI measures simultaneous deprivations across health, education, and living standards. Nigeria’s MPI headcount stands at 33.0% based on 2021 survey data, with an intensity of 52.9%. The lower headline figure relative to the monetary rate reflects the different methodology, not a more optimistic reality.
Key limitations you should know before citing either figure:
- Survey timing lag: The most recent NBS household survey underpinning the 2019 baseline is now several years old. More recent estimates rely on modeling and extrapolation, not fresh microdata. The MPI 2025 brief uses 2021 survey data.
- Conflict-state exclusions: Some survey rounds excluded Borno and other conflict-affected states, which means national averages understate poverty in the worst-affected areas.
- Measurement differences create apparent discrepancies: The 33% MPI figure and the 62–63% monetary figure are not contradictory. They measure different things. A household can be above the monetary poverty line but still lack electricity, safe water, or secondary schooling.
- Population growth: Nigeria’s population grows by roughly 2.5–3% annually, so even a stable poverty rate means millions more people in absolute poverty each year.
The World Bank data portal is the standard reference for Nigeria’s national poverty headcount time series and is the source researchers should use for cross-year comparisons.
How do the 2026 projections compare, and what scenarios could change the outlook?
The two headline projections for 2026 are broadly consistent but differ in framing and timeframe.
The World Bank’s baseline scenario assumes continued macroeconomic stabilization, moderate growth, and incremental expansion of social protection. The IMF’s caution is the important qualifier: if global food and fertilizer prices spike again, the modest improvement projected for 2026 could reverse quickly.
Three scenarios shape where Nigeria lands:
- Baseline: Inflation continues cooling, agricultural output recovers partially, and cash transfer programs expand their reach. Poverty edges down from 63% toward 60–62% by end-2026.
- Downside: A new global food or fuel price shock, or a deterioration in security in the Northwest, pushes food prices higher and disrupts harvests. Poverty stays above 63% or rises further.
- Upside: Faster-than-expected job creation in manufacturing and agriculture, combined with effective cash transfer delivery to the poorest households, accelerates the decline toward 58–59% by late 2026.
The upside scenario requires policy execution at a pace Nigeria has not yet demonstrated. The baseline is the most defensible projection given current evidence. For broader context on growth projections, Naijatipsland’s coverage of Nigeria’s World Bank growth outlook for 2026 explains how GDP growth and poverty reduction can diverge when growth is concentrated in capital-intensive sectors.
What is Nigeria doing about poverty, and where are the gaps?
Nigeria has a set of social protection instruments in place, but implementation gaps are significant.
| Program | Intended Reach | Main Constraint | What Success Looks Like |
|---|---|---|---|
| Targeted cash transfers (federal) | Poorest households on National Social Register | NIMS integration delays, funding gaps | Regular, predictable payments reaching 10+ million households |
| National Social Register (NSR) | Verified poor households | Data coverage incomplete in conflict states | Full national coverage with updated household data |
| Agricultural input subsidies | Smallholder farmers | Leakage, targeting errors | Verified delivery to smallholders with yield monitoring |
| School feeding program | Primary school children | Logistics, procurement irregularities | Consistent daily meals with nutritional standards |
| Nutrition programs (UNICEF/WFP supported) | Children under 5, pregnant women | Funding dependence on donors | Domestically funded, scaled to need |
The most critical bottleneck is the integration of the National Social Register with the National Identity Management System (NIMS). Without that link, cash transfers cannot be reliably targeted or verified, which slows rollout and creates leakage. This is a technical problem with a known solution — it requires political prioritization and dedicated funding, not new policy invention.
Pro Tip: For researchers tracking Nigeria’s social protection system, the World Bank’s Nigeria Poverty and Equity Briefs (available at the World Bank Documents portal) provide the most detailed program-level analysis and are updated twice yearly. Use the October editions for the most current pre-budget data.
What do these numbers mean for Nigerian households day to day?
It describes the daily reality of food choices, school attendance, and health decisions for the majority of Nigerians.
The World Bank’s Nigeria Poverty and Equity Brief and IMF analysis both flag food insecurity as a direct consequence, with estimates of 27–33 million Nigerians facing acute food insecurity at the peak of the 2024 price surge.
Common coping strategies observed across Nigerian states include:
- Reducing meal frequency: Many households dropped from three meals to two, or two to one, during the 2023–2024 price spike.
- Substituting cheaper, less nutritious foods: Protein sources like eggs and fish were replaced with carbohydrate-heavy staples.
- Pulling children from school: School fees, uniforms, and transport became unaffordable for households already cutting food spending.
- Asset sales: Livestock, farm equipment, and household goods were sold to cover immediate food needs, deepening long-term vulnerability.
- Migration: Young men from rural northern states moved to urban centers or crossed borders seeking income, often finding only informal, low-wage work.
Consider a smallholder farming household in Jigawa State. In 2022, they grew enough sorghum to feed the family and sell a small surplus. By 2024, fertilizer costs had doubled, fuel for transport tripled, and the naira had lost more than half its value against the dollar. The surplus disappeared. The family sold one of their two goats to buy food in the lean season. With one fewer goat, they have less to sell next year. The poverty statistics count them; the statistics do not show the compounding.
Pro Tip: Microfinance institutions operating at the community level can help households rebuild productive assets after shocks. For background on how microfinance functions in the Nigerian context, Naijatipsland’s piece on microfinance and economic growth in Nigeria provides useful grounding.
Where do the 2026 figures come from, and how should you read them?
Knowing which report to cite — and what each one actually measures — saves researchers from conflating incompatible figures.
Primary sources for Nigeria poverty statistics 2026:
- PwC Nigeria Economic Outlook 2026 (reported via BusinessDay): Projects 62% / 141 million for 2026. Uses national monetary poverty line. Forward-looking model based on macroeconomic assumptions. Cite for 2026 headline projection.
- World Bank Nigeria Development Update (April 2026): Reports 63% for 2025 and projects ~59% by 2028. Uses national poverty headcount methodology. The most authoritative institutional source for trend analysis.
- IMF Article IV Consultation (2026): Confirms 63% for 2025 and flags food/fuel price risks. Useful for macro-policy context and risk scenarios.
- OPHI Global MPI Country Brief 2025: Reports 33.0% MPI headcount (2021 survey reference). Use for multidimensional poverty analysis and subnational comparisons.
- UNDP MPI Country Profile 2025: Reports the same 33.0% MPI headcount with intensity of 52.9%. Explains methodology differences between MPI and monetary measures. Use when comparing Nigeria to other countries on the MPI scale.
- NBS Poverty and Inequality in Nigeria 2019: The baseline survey. Use for the 40.1% / 82.9 million 2019 figure. Note the Borno exclusion when citing.
How to use these sources correctly:
- Never mix MPI and monetary poverty rates in the same sentence without labeling which is which.
- When citing the 63% figure, specify whether it is the 2025 observed rate (World Bank/IMF) or a 2026 projection.
- For subnational comparisons, use the OPHI MPI brief — it has state-level data. The national monetary headcount does not break down by state in the same way.
- For time-series work, the World Bank data portal’s national poverty headcount series is the standard reference.
- Check survey reference years carefully. The MPI 2025 brief uses 2021 data; projections from World Bank and PwC use modeled estimates, not fresh surveys.
Why haven’t macro gains reached households? An expert view
Nigeria’s economy has stabilized at the macro level. The exchange rate is more unified, inflation has begun to cool, and the fiscal position has improved with subsidy savings. Yet poverty in Nigeria in 2026 remains near its highest recorded level. The explanation is not complicated, but it is often understated.
World Bank lead economist Fiseha Haile, commenting on the April 2026 Nigeria Development Update, attributes the persistence of high poverty to a failure of growth to translate into real household income increases and jobs. Growth has been concentrated in sectors like finance and telecommunications that employ relatively few workers at scale. Agriculture, which employs the majority of Nigeria’s poor, has grown slowly and remains vulnerable to input cost shocks and climate variability.
Three policy interventions have the strongest evidence base for near-term impact:
- Targeted cash transfers at scale: Direct, regular payments to households on the National Social Register reduce food insecurity immediately and have measurable multiplier effects in local markets. The constraint is not the policy design — it is the NIMS integration bottleneck and funding continuity.
- Agricultural productivity measures: Subsidized fertilizer delivery verified through digital systems (not paper vouchers), combined with extension services, can raise smallholder yields within a single growing season. The IMF Executive Directors specifically flagged fertilizer price exposure as a key risk; addressing it directly is both a poverty and a food security intervention.
- Immediate food price interventions: Targeted food price relief — whether through market support, import facilitation, or direct food assistance — reaches poor households faster than income-side interventions. The IMF’s Article IV consultation explicitly recommended targeted support to offset food insecurity risks from global price volatility.
The deeper structural issue is that Nigeria’s growth model has not been labor-intensive enough to lift the majority. Early childhood development investments — flagged by Fiseha Haile as a long-term lever — will not show results for a decade. The 2026 policy priority has to be protecting household consumption now, while building the human capital base that makes future growth more inclusive. For current affairs context on how these economic reforms are playing out, Naijatipsland’s top current affairs topics impacting Nigeria in 2026 covers the policy debate in real time.
What to watch in the months ahead
The indicators that will tell you whether Nigeria’s poverty rate is actually improving are not the headline GDP figures. They are the ones that show up in household budgets first.
Food and fuel price paths matter most.
Watchlist for 2026:
- Food CPI monthly readings: Falling food inflation signals real relief for poor households; a reversal signals a downside scenario.
- Cash transfer rollout speed: The number of households receiving regular payments under the National Social Register is the single best leading indicator of safety-net effectiveness.
- Harvest outcomes (Q3 2026): Nigeria’s main harvest season results will determine food availability and farm incomes for the rest of the year.
- Security situation in the Northwest: Deterioration means more displacement, more disrupted harvests, and higher poverty in already-vulnerable states.
- Naira stability: A fresh depreciation episode would immediately raise import costs and food prices, reversing any gains from cooling inflation.
- NBS survey release: Any new household survey data from NBS will be the most important poverty statistics Nigeria produces in 2026 — watch for the release date and methodology notes.
Sources
The following primary reports are the authoritative references for Nigeria’s poverty statistics and projections. Use them for academic citation, policy briefs, and further research.
This article provides general informational analysis based on publicly available data and institutional reports. Figures are estimates and projections subject to revision as new survey data becomes available. Readers making policy or investment decisions should consult the primary sources directly and verify current figures with the NBS, World Bank, or IMF.
Recommended
- Top Current Affairs Topics Impacting Nigeria In 2026
- Mobile Technology’s Role For Nigerian Youth In 2026
- Top Scholarships In Nigeria 2026: Best Awards Guide
- Digital Literacy: Essential Skills For Nigerian Youth 2026
Sources for the October 2026 Update
- Vanguard: Nigeria poverty rate climbs to 63% despite easing inflation, World Bank
- Nairametrics: Global multidimensional poverty rises, Nigeria reverses gains
- Tribune: 113 million Nigerians are deprived of health, education, living standards
- allAfrica: Nigeria economic growth insufficient to reduce poverty, World Bank report