


Bitcoin [BTC] traded within a narrow $62,000 to $65,000 range over the past week.
On-chain data pointed to a possible recovery setup. However, longer-term Spot Flows still showed that sellers retained influence.
Is Bitcoin finding a bottom?
Supply in Profit tracks the share of Bitcoin’s circulating supply held at a profit.
At press time, roughly 11.44 million BTC sat in profit. The metric remained within the lower market band between Bottom Discovery and Liquidity Accumulation.
Previous periods in this range often preceded major recoveries. However, the metric alone could not confirm that Bitcoin had formed a cycle bottom.
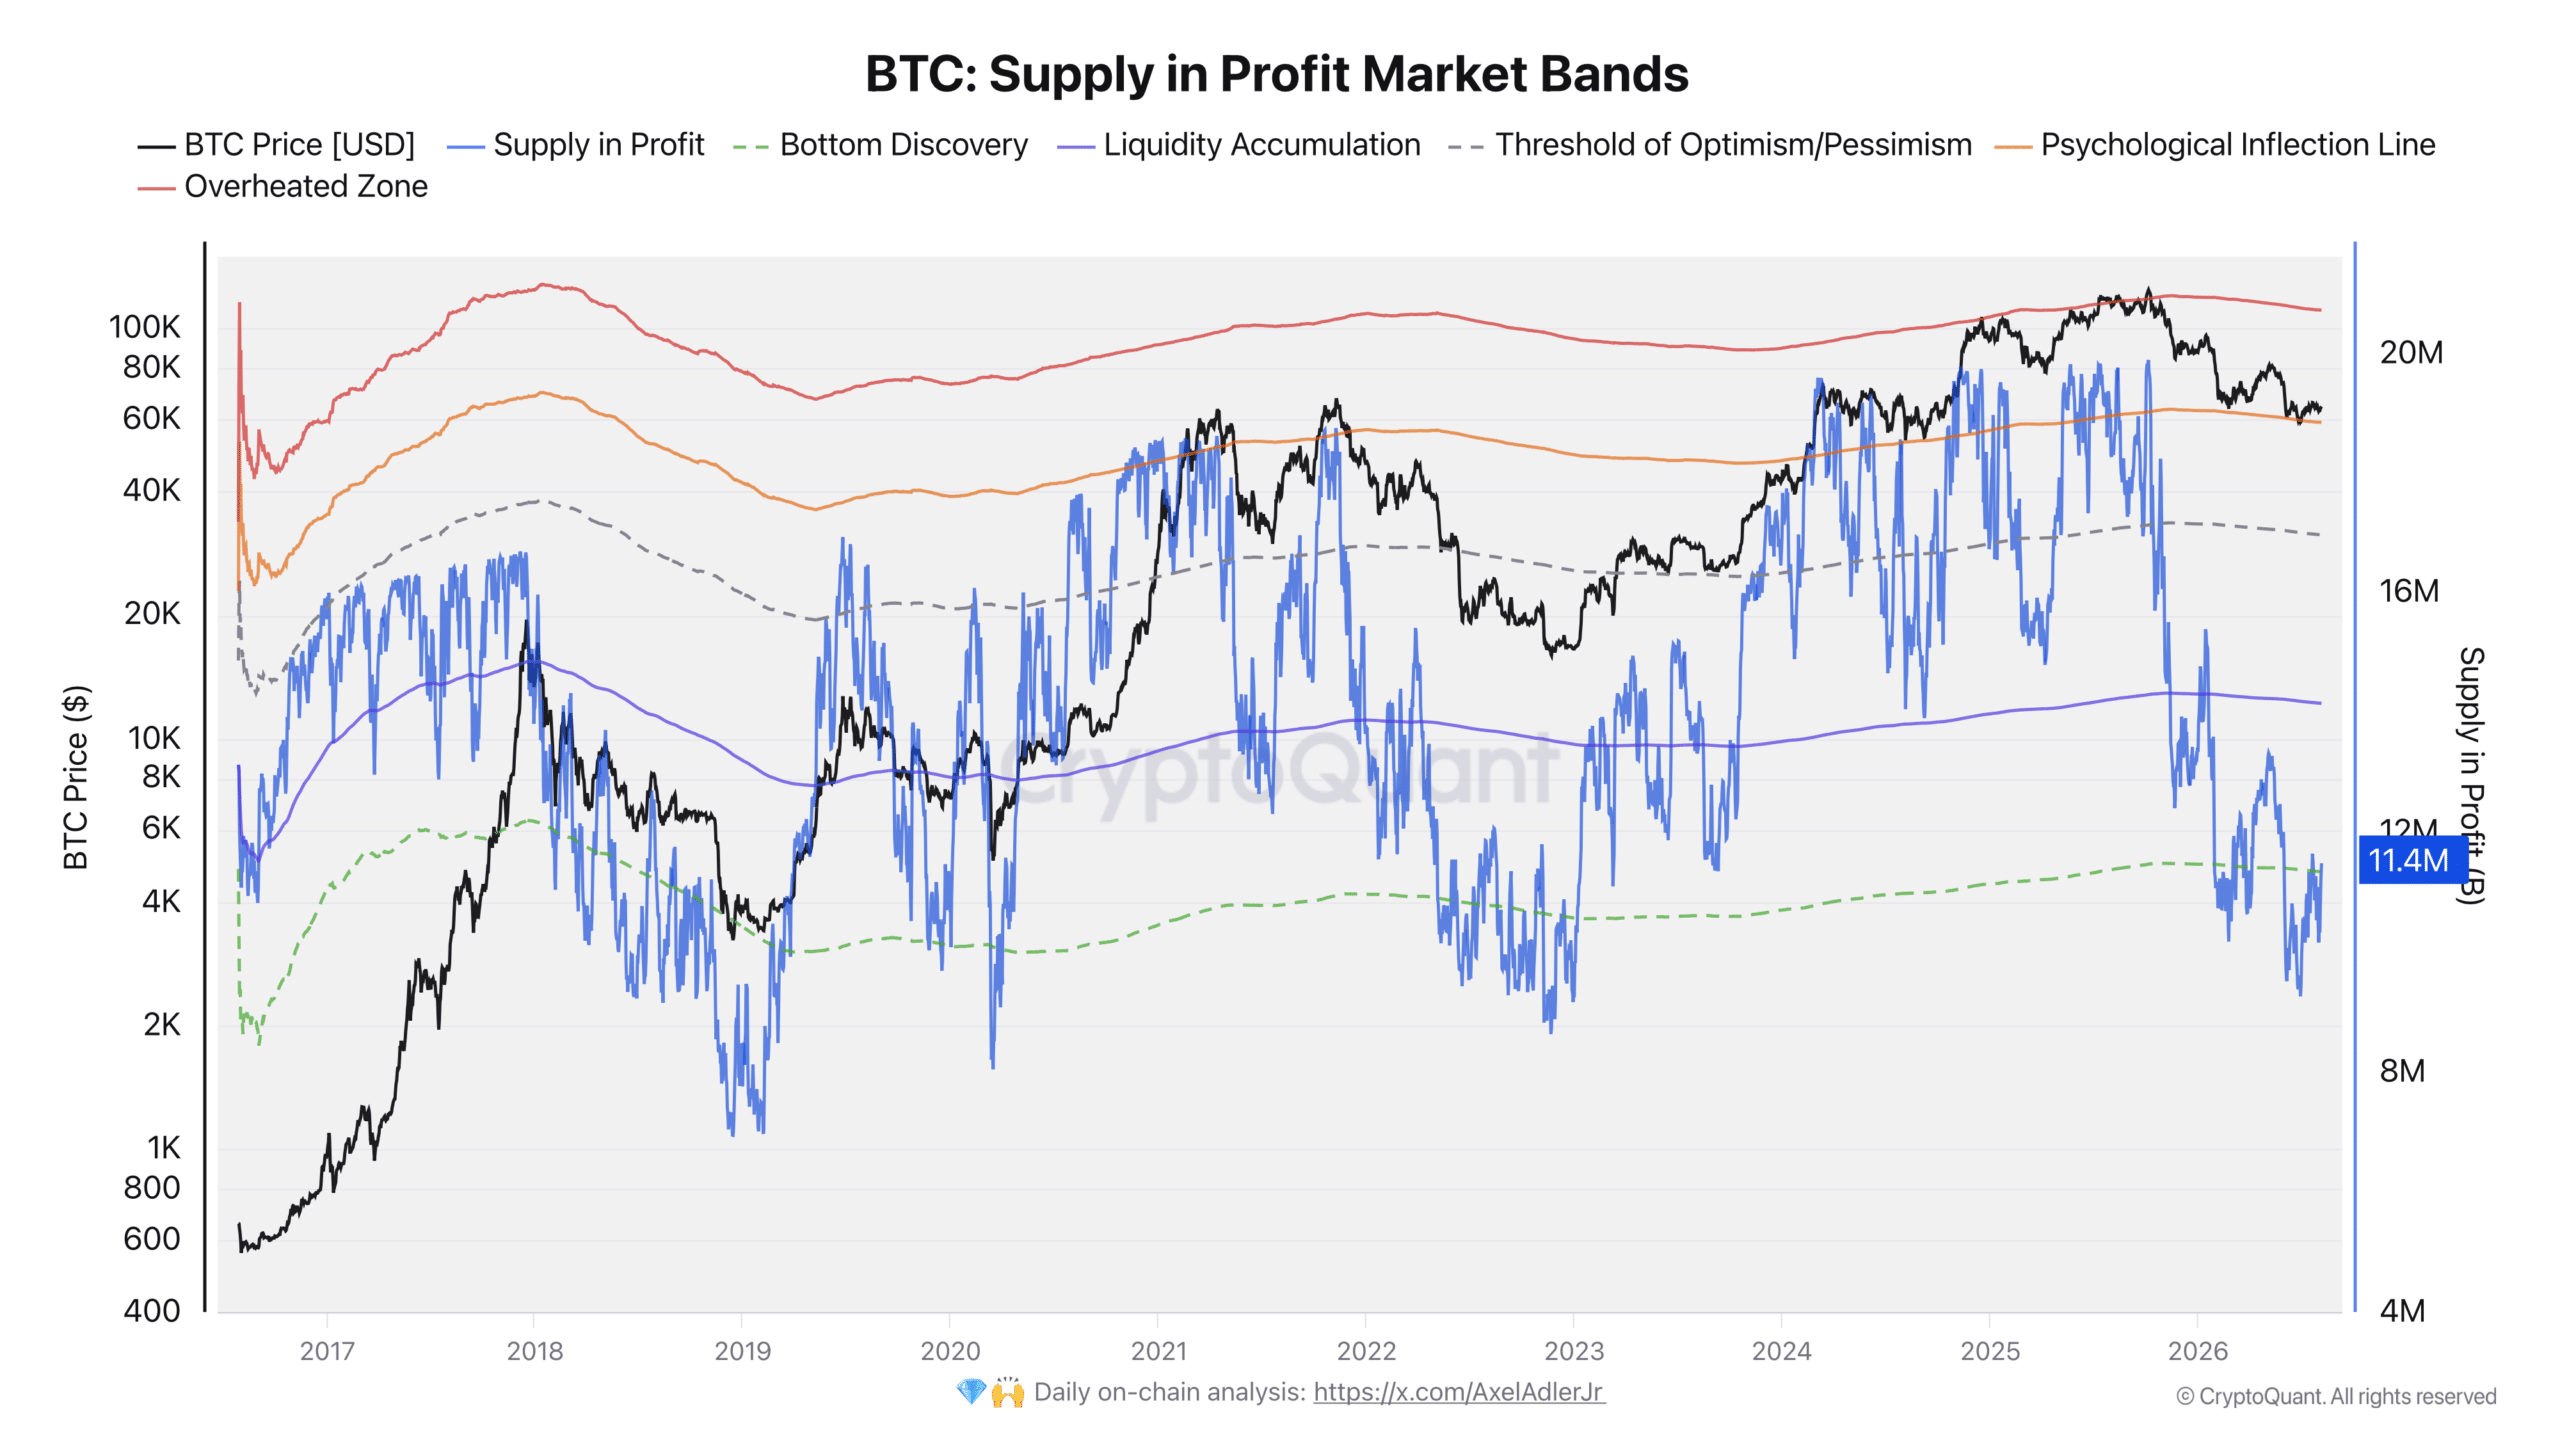
The setup nevertheless suggested that downside risk may have moderated after Bitcoin’s recent correction.
Are short-term holders supporting a Bitcoin rebound?
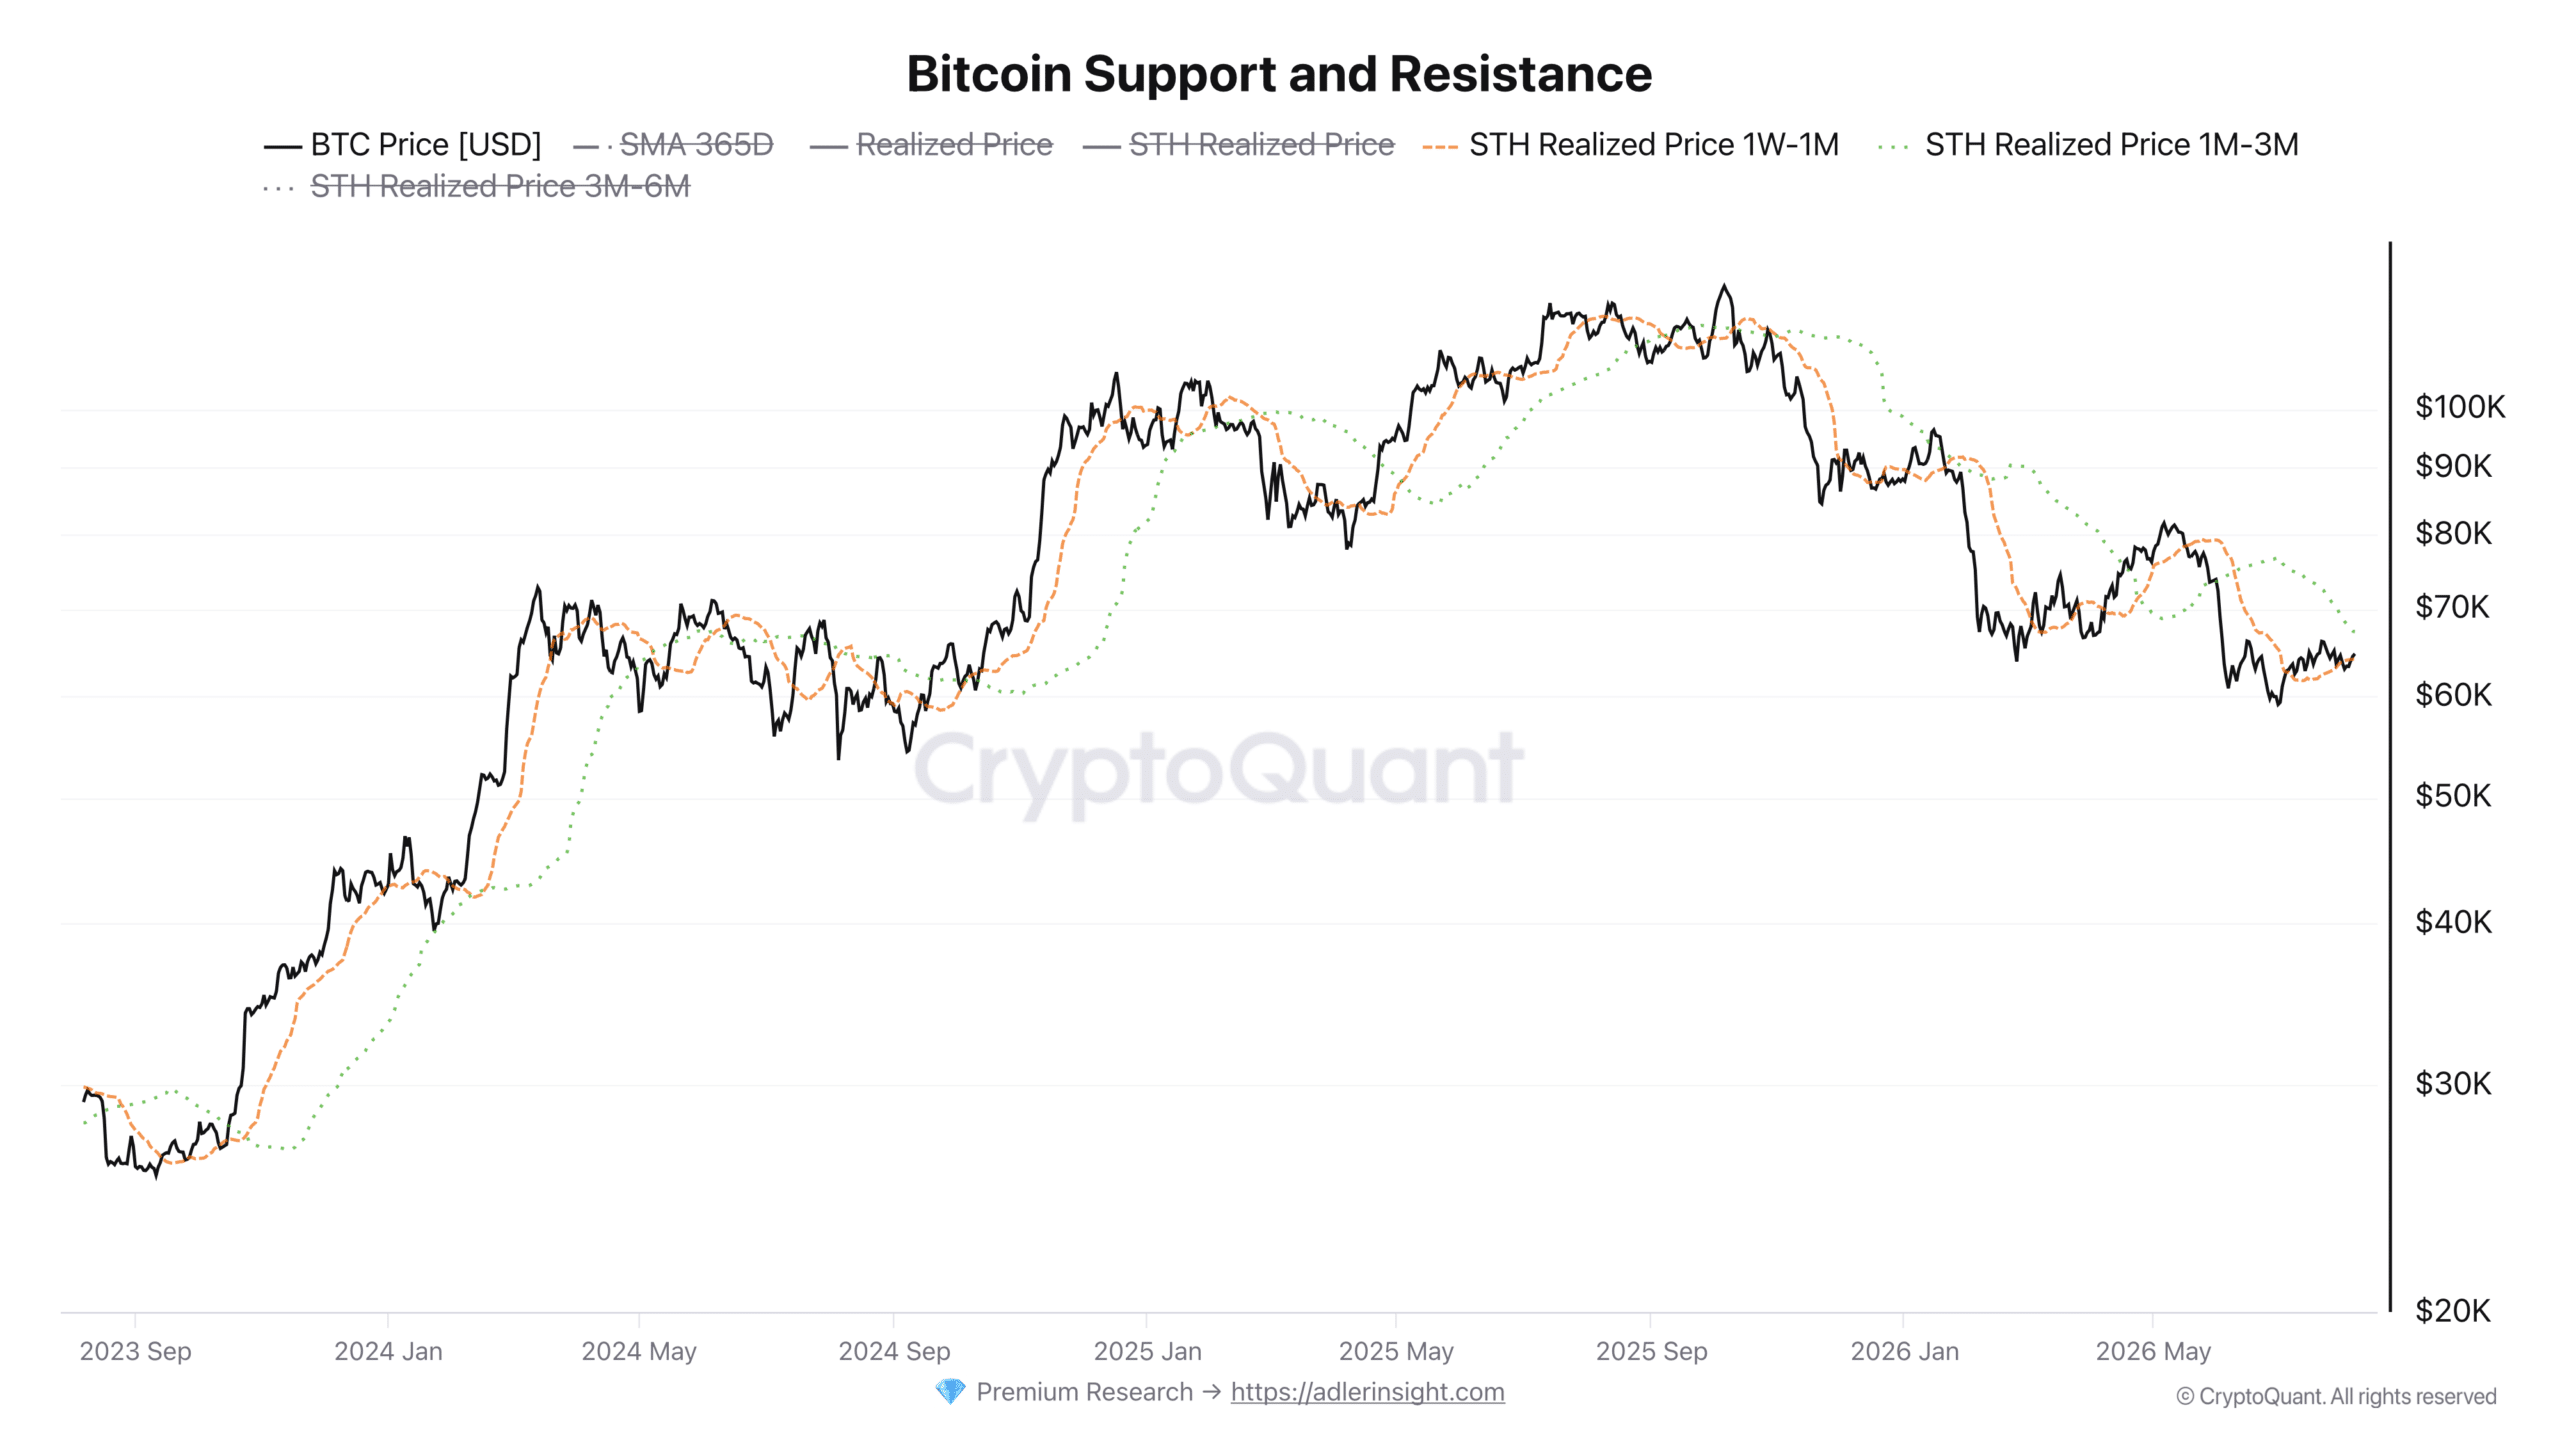
The Short-Term Holder Realized Price chart compared buyers from one week to one month with those from one to three months. The orange 1W-1M line remained below the green 1M-3M line. However, the two lines appeared to be converging.
A bullish crossover would occur if the orange line moved above the green line. Such a shift would suggest that recent buyers entered at progressively higher prices.
That would support a stronger demand recovery. For now, Bitcoin had not confirmed that crossover.
Does Bitcoin need stronger capital flow?
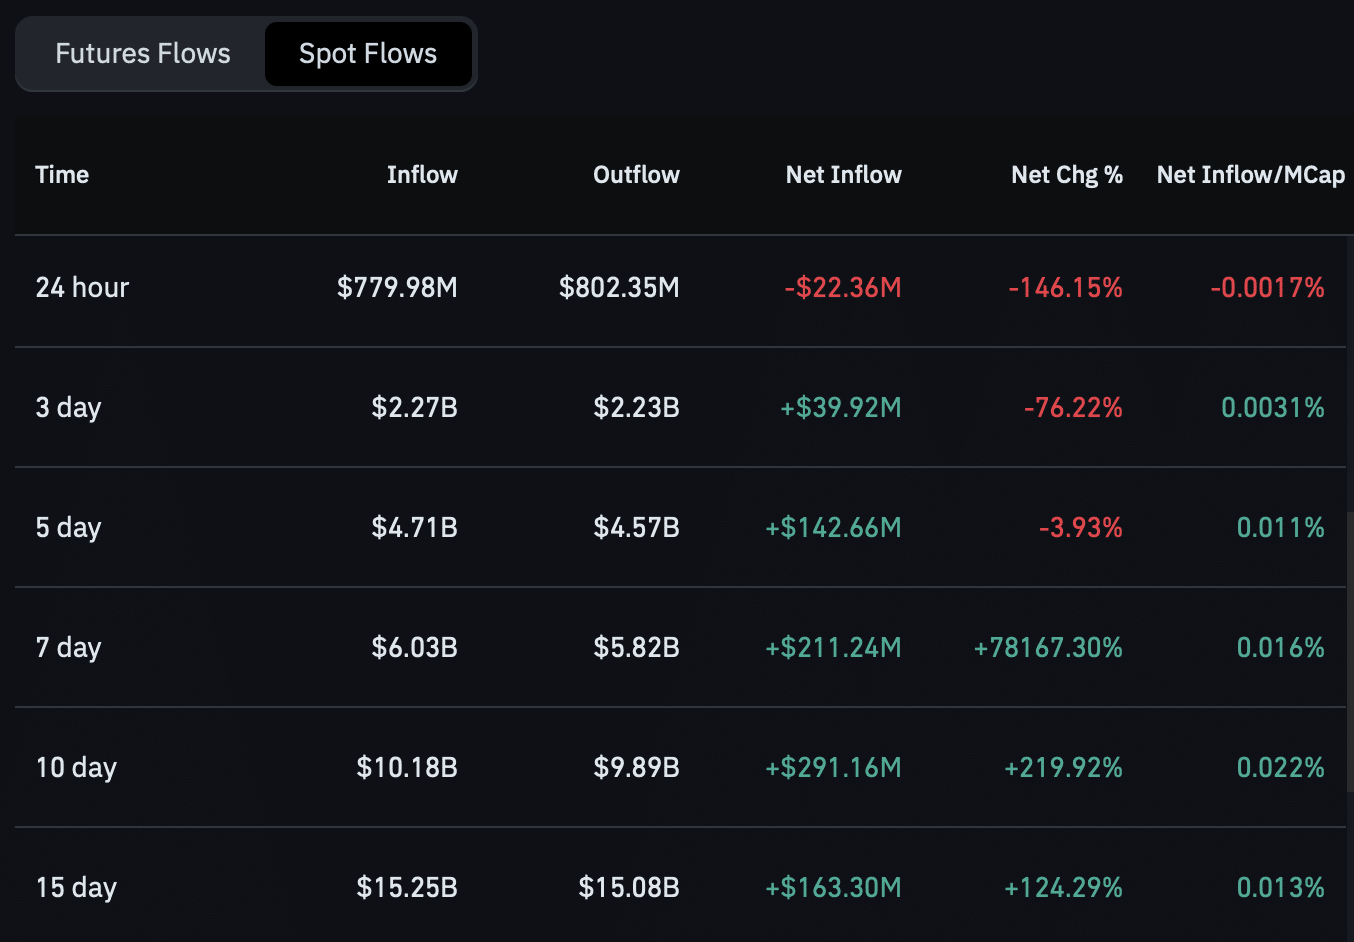
Spot Flows showed mixed demand across different timeframes.
Over 24 hours, $22.36 million in Bitcoin moved off exchanges. This reduced the supply immediately available for sale.
However, seven-day Spot Netflows showed $211.24 million moving onto exchanges. The 15-day reading also showed $163.30 million in Exchange Inflows.
These longer-period inflows suggested that sell-side pressure had not disappeared. Bitcoin may remain range-bound until buy-side demand absorbs that supply.
Final Summary
- Bitcoin Supply in Profit stayed within the lower market band, suggesting downside pressure may have eased.
- Short-Term Holder Realized Price lines converged, but Bitcoin had not confirmed a bullish crossover.