
Binance’s SAFU Fund bought another 3,600 bitcoin worth about $233.37 million, according to blockchain analytics account Lookonchain. As a result, the purchase lifted the fund’s total recent buying to 6,230 BTC, valued at about $434.5 million.

Binance SAFU Fund BTC Transfers. Source: Arkham Intelligence
Onchain records shared by Lookonchain showed fresh transfers into the Binance SAFU Fund address from a Binance hot wallet shortly before the post. At the same time, earlier transfers in recent days reflected additional inflows that together matched the cumulative total cited in the update.
Net buying returns as Bitcoin steadies near $64,700, trader says
Net buying in bitcoin is showing up again after a long stretch of selling pressure, according to trader CW, who posted the claim on X. The post pointed to exchange charts that showed a sharp selloff followed by a rebound, while an order flow style indicator flipped upward into positive territory.


Bitcoin Multi Exchange 1H Charts. Source: TradingView via CW8900
A TradingView chart set shared with the post showed BTC trading around the mid $64,000s across several venues, including Coinbase’s BTCUSD, Binance’s BTCUSDT perpetual, Binance spot BTCUSDT, and OKX BTCUSDT on the 1 hour timeframe. Meanwhile, the lower pane indicator turned sharply higher after the dip, which CW described as a return of net buying.
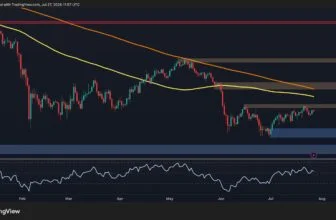
Bitcoin searches for monthly low as RSI dips, trader says
Bitcoin may be forming a monthly low, with the relative strength index pointing to a potentially important bottom, according to Trader Tardigrade, who posted the view on X. The analyst said the RSI suggests this month “might be the lowest level for the next couple of years,” and added that the setup “could mark the beginning of the next bull run.”

Bitcoin Monthly RSI Chart. Source: Trader Tardigrade via X
A chart shared with the post showed Bitcoin’s 1 month candles alongside an RSI line in the lower panel. The graphic highlighted prior “RSI breakdown” moments and a repeated “12 bars” window that the analyst linked to earlier cycle turns. It also marked two prior points labeled “Start of Bull Run” after earlier RSI drops.